July 15, 2014
Organizing a Data Analysis Project
Deprecated (April 2020)
I have written an updated version of my data analysis project organization system here.
Over the past several years, I’ve been working on a standard way for organizing my data analysis projects.
Data analysis is bread-and-butter work for an epidemiologist: you start with some data, write code for data cleaning and statistical analysis, and hopefully turn your analysis into a publication.
I’ve discovered there are some big benefits to always organizing these projects the same way. For example:
- Switching between working on different projects is quicker and easier because data and code are always in the same place within each project.
- It’s easier and faster to pick up a project after not working on it for a few weeks.
- Mistakes like overwriting original data are harder to make (and recoverable).
- Collaborating is easier with a clear organizational structure and a bit of standardized documentation.
- Code runs faster in practice because it’s modular (I describe this in more detail below).
- Backups are easier and less error-prone because it’s clear what needs to be backed up.
The bottom line is this system saves time and reduces mistakes.
Folder structure
I keep all the work for a given project in the same folder, and I always organize this folder the same way:
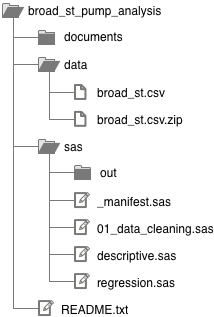
You’ll probably want to refer back to this diagram as you continue reading.
Statistics package code. I keep all my SAS code in the sas/ folder, and I set SAS to save any output to sas/out/ so it doesn’t clutter up my code. If I was using Stata or R instead of SAS, I would create a new top-level folder called stata/ or r/. I’ll get into the different .sas files below; these are equivalent to .do files in Stata and .r files in R.
Data. I keep all my data files in the data/ folder. I always make a .zip archive of my raw data so if I accidentally save over the raw data I can restore it.
Everything else. I keep Word documents, slide decks, graphs I make in DataGraph (my graphing package of choice), etc. in the documents/ folder. I’ll make sub-folders in here as I see fit.
Note
In this article I use SAS in this article as my example statistics package. However, I typically use Python, R, and Stata for data analysis – any of these could replace SAS below, and this structure works well with multilingual projects.
Statistics package code
These are the code that runs in SAS, Stata, R, etc. for doing data cleaning, merging data, running statistical analysis, etc. (Here I’ll use SAS for my examples, corresponding to the sas/ folder above.)
Regardless of what statistics package I use, I’ve found that working with data generally involves the following steps:
- I start off with one or more raw data files.1
- I then write some code to produced a derived dataset, which is based off of the raw data.
- I then run a bunch of analysis code (e.g. descriptive statistics, regression, etc.) on the derived dataset.
So, I split my code into two categories: (1) producing derived data and (2) analysis.
Derived data
The most important thing about this workflow is to produce all your derived data in a series of reproducible steps starting from the raw data.
In my example, sas/01_data_cleaning.sas would produce a derived dataset: it would import data/broad_st.csv and then, for example, combine some duplicate observations before saving a SAS dataset to data/.2
The 01 in the filename signifies that it should be run first. If I had more complicated data cleaning, I might create a second cleaning file. For example, I might create sas/02_merge_geo_data.sas to merge in some geographic data from another source. Splitting up these files is purely for convenience: when code files get too long, they become difficult to navigate.
In any case, I know that if I run all my .sas files that begin in 01, 02, etc. in order, I will end up with the derived dataset I can use in my analysis.
Saving derived datasets
For any derived datasets used in analysis, I save them in the data/ folder with the prefix drv_. For example, the end product of my derived data code might create data/drv_broadst_geo.sas7bdat.3
The drv_ prefix is important. It signifies that these files are safe to delete because they can be reliably recreated by running the derived data code in order. It also indicates clearly that you are working with your derived data in analysis.
I also try to make the filenames of derived datasets short and descriptive. Never name derived datasets data/drv_broadst1.sas7bdat, data/drv_broadst2.sas7bdat, etc. It quickly gets impossible to remember which dataset is which.
Saving intermediate datasets
Sometimes it’s necessary to create a dataset along the way to creating a derived dataset. I call these datasets “intermediate” because unlike drv_ (derived) datasets, they are never used by my analysis code.
I prefix intermediate datasets with tmp_ to indicate they are temporary and can be safely deleted after my code has run.
If you use SAS, you can store intermediate datasets in a temporary library like work to make sure these datasets are deleted automatically when you quit SAS.
Analysis
I consider any code that is not manipulating data to be analysis code. In my example, the analysis files are sas/descriptive.sas and sas/regression.sas. Again, I split them up purely for convenience: it’s quicker to navigate and understand smaller files.
There are no numbers prefixing my analysis files because they can be run in any order.
I never modify derived datasets in my analysis files. This is beneficial because it allows me to run the code to generate my derived datasets just once when I start working on analysis. After that, I can just run the analysis file I’m working on without running all the derived dataset code each time. With large datasets or complicated code for creating the derived datasets, this saves a lot of time waiting for code to run.
If I do need to create a dataset in my analysis (e.g. saving regression output to a dataset for further analysis), I save it in a tmp_ dataset and only reference it within that specific .sas file.4
Manifest
The sas/_manifest.sas file makes it easy to run all the code in the project at once. It includes references to the other files in the sas/ folder, with the derived data code files in numerical order and the analysis code files in a logical order.
This is a good place to provide short comments explaining the purpose of each file.5
The manifest file should allow a smart stranger to quickly reproduce your derived data and analysis just by running this file.
Here are examples of manifest files for SAS and Stata.
Data
There are 4 kinds of files that will end up in the data/ folder:
- Raw data files (e.g.
data/broad_st.csv). - Derived data files prefixed with
drv_(e.g.data/drv_broad_st_geo.sas7bdat). - Temporary data files prefixed with
tmp_(e.g.data/tmp_regression_output.sas7bdat). - Zip files of all raw data files for backup purposes (e.g.
data/broad_st.csv.zip).
I make dataset filenames descriptive and never use incremented filenames (data/drv_clean1.sas7bdat, data/drv_clean2.sas7bdat, etc.). Incremented filenames are an anti-pattern and always end in tears.
Documents
This is my catch-all folder for the other files associated with a data analysis project, such as Word and PowerPoint files, figures, and PDFs. I create a folder structure within documents/ as I see fit.
If I’m working on submitting a manuscript or abstract, I will generally create a folder like documents/jama1/ for everything related to my first submission to JAMA.6 For a conference, I would create a folder like documents/IDWeek2014/.
When I have multiple versions of files in documents/, such as for versions of a manuscript written in Word, I like to include dates in YYYY-MM-DD format. For example: Broad St JAMA 2014-07-20.docx. This will keep all the files beginning with Broad St JAMA sorted in order by date.
It should go without saying: data and analysis code should never be stored in documents/.
Readme
Your README file should contain enough information for a smart person who has never seen your project before to be able to reproduce your analysis starting with just the raw data and your code.
This usually means it should include at a minimum:
- The purpose of the project
- Who is involved
- Where the data come from, and the version of the data7
- What software is used for analysis
- A description of how the project is organized and how to run the code (or a link to this page:
http://bit.ly/analysis_org)
It doesn’t have to be long, though. Here’s an example of an adequate README for a simple project.
I generally write my README files in Markdown, which is both readable as plain text and can directly produce pretty output. The example README I linked to above is actually written in Markdown. The pretty version looks like this.
I don’t like using Word files for READMEs because I like to be able to open the README in the same program I edit my analysis code in. But a README in any format is better than no README, so use whatever you feel comfortable with.
Getting started
Here’s how I start a new project using this system:
Create a new folder in my
projects/folder where all my dta analysis projects live.8 Now I haveprojects/broad_st_pump/.9Create the necessary folders in my project folder. So now I have
projects/broad_st_pump/data/,projects/broad_st_pump/documents/,projects/broad_st_pump/sas/,projects/broad_st_pump/stata/, etc.Move or copy my raw data files into
projects/broad_st_pump/data/. Make a.zipfile for each raw data file in case I accidentally overwrite one.Create
projects/broad_st_pump/README.txtas described above.Create files for my code. I usually start with:
sas/_manifest.sassas/01_cleaning.sassas/analysis.sas
I will split up the cleaning and analysis files as needed as I write my code, updating the manifest file accordingly.
- This means data directly from a survey, downloaded from a government website, etc. [return]
- The derived dataset from SAS is not shown in the diagram above, but it would be called something like
data/drv_broad_st_clean.sas7bdat. I explain this naming convention below. [return] .sas7bdatis the file extension for a SAS dataset. It’s similar to a.dtafile with Stata or a.RDatafile with R.
See here for more about how libraries work with saving data in SAS. [return]- This is important: if I reference it in another file, then I would have to run my analysis files in a specific order. The rule of thumb is that I should able to run my derived data code once, and then run any analysis file without getting any errors. [return]
- You should also have good comments throughout all your analysis code. [return]
- In this case, incrementing folders is ok because it refers to a specific submission, and there are generally multiple submissions to the same journal before a paper is published. [return]
- The easiest way to do versions is by putting a date in the filename of the raw dataset and then referencing that in the README.
A better way is to use a checksum. Here are instructions for safely calculating a MD5 checksum on any file. [return] - I keep all my projects in one folder and use search to quickly filter through it, but if you like a deeper folder hierarchy that’s fine. [return]
- I use
broad_st_pumprather thanBroad Street Pumpbecause Stata requires quotes around filenames with quotes in them. [return]
Comments? Please send me a message.