Small Multiples
Summary:
An effective technique for showing differences over time or among categories of data in a small amount of space.
Details
According to Edward Tufte (The Visual Display of Quantitative Information, 2nd Ed., p. 168):
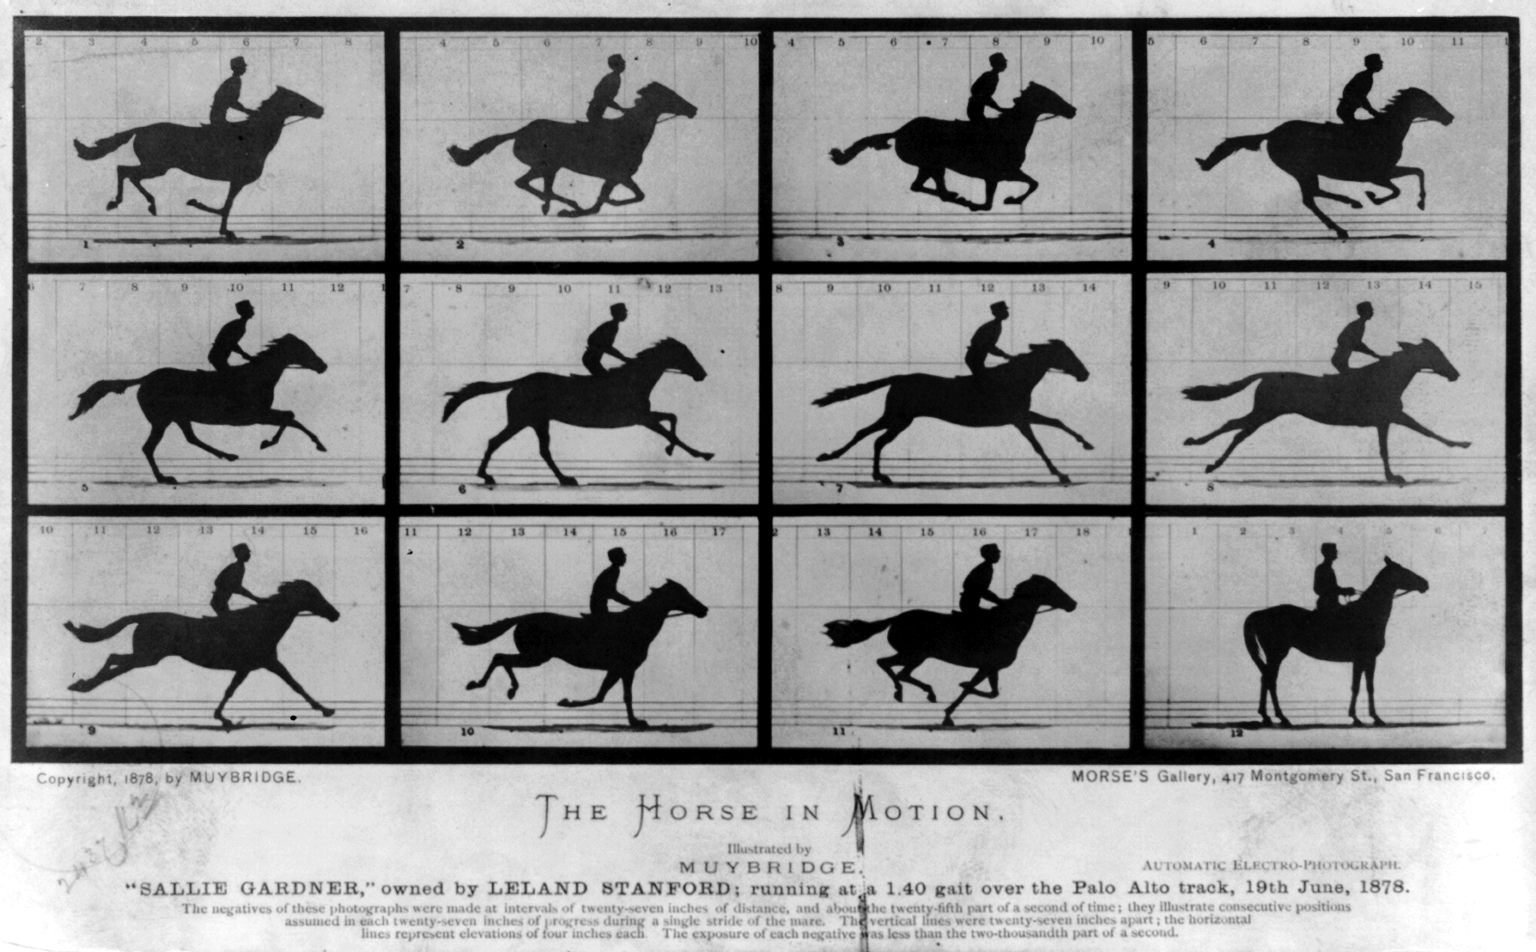
Small multiples resemble the frames of a movie: a series of graphics, showing the same combination of variables, indexed by changes in another variable.
An example is “The Horse in Motion”, which shows how the gait of a running horse changes over time.
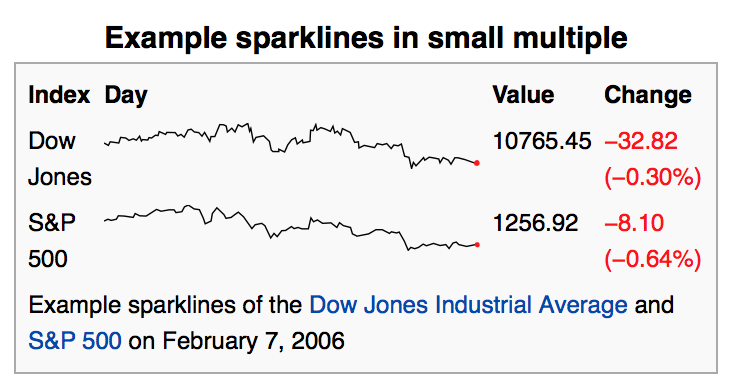
Another example are sparklines, which show how data change over time:
Small multiples allow the viewer to visually compare characteristics of data quickly among categories. It is an effective technique when:
- Recognizing general trends is more important than showing exact numbers
- There are large numbers of categories of data to be compared
- Space is limited